Xibo is a powerfull Open Source Digital Signange CMS to bring Content to public Displays. In our Company in my Team we wanted to display the amount of bugs versus the amunt of UnitTests, Codecoverage and others. Therefore out central IT department gave us Access to our Xibo installation where we where able to show pages from Jira, SonarCube and others. With that I was not really happy and started to create a custom module for Xibo to draw graphs with data from one but also multiple systems over time. See Github LukyLuke/xibo_rgraph.
To show graphs on a Website I found RGraph some time ago. This was for now the ideal JavaScript-Library to use with Xibo, becasue it has Canvas- and SVG Support which is supported by the used Internet-Explorere component in the Xibo-Client.
Installation
What you need is a running Xibo-1.8 installation. Download or clone Github LukyLuke/xibo_rgraph directly into the xibo installation (or copy everything). The folder structure should match and there is no need for more setup or any other downloads.
After this, go to the module settings page and enable the RGraph Module.
Settings
Currently the module is working as expected and is able to display one DataSet from the internally managed DataStore, or it can request up to two JSON-RPC for fetching data from remote hosts.
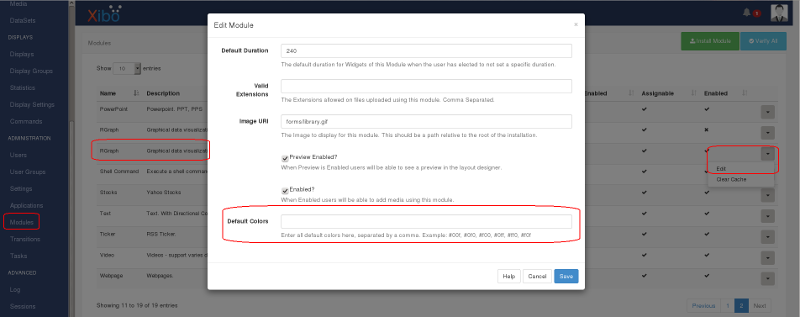
In the main settings dialog you can define the default colors used for printing the Graphs. Not forget to enable the Module here.
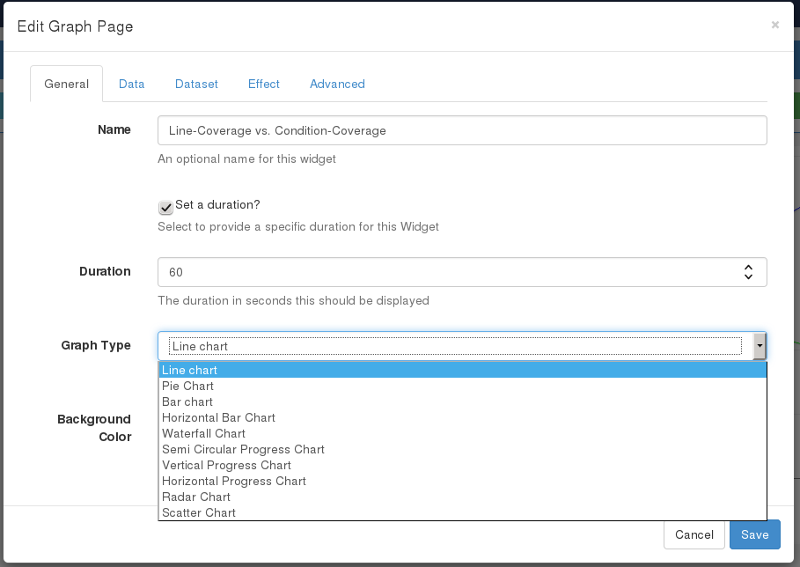
On the page settings there are a lot of settings to make. On the main page you have to choose the type of graph to show:
On the Data-Pane you can choose the type of Data to show. Depending on the selection even “JSON” or “Dataset” is shown on the panes area.
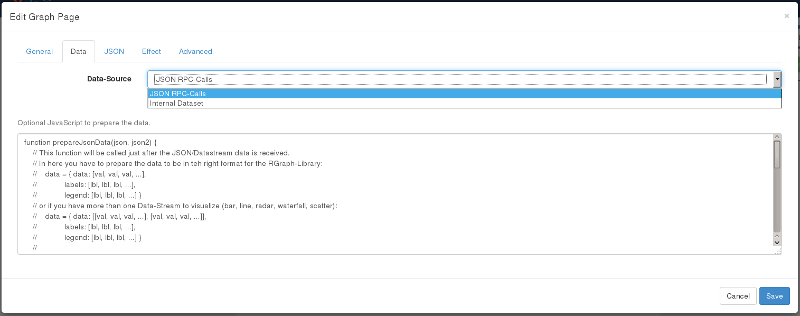
The optional Javascript is for creating the right data-structure for RGraph. If you’re using a DataSet, just return json.
For Example there could be something like this when you request Data from SonarCube:
function prepareJsonData(json, json2) {
    // This function will be called just after the JSON/Datastream data is received.
    // In here you have to prepare the data to be in teh right format for the RGraph-Library:
    //    data = { data: [val, val, val, ...],
    //             labels: [lbl, lbl, lbl, ...],
    //             legend: [lbl, lbl, lbl, ...] }
    // or if you have more than one Data-Stream to visualize (bar, line, radar, waterfall, scatter):
    //    data = { data: [[val, val, val, ...], [val, val, val, ...]],
    //             labels: [lbl, lbl, lbl, ...],
    //             legend: [lbl, lbl, lbl, ...] }
    //
    // The 'data' contains all Data values as nummeric (float/integer)
    // The 'labels' contains all X-Axis labels. For better readibility just show every 10th label only
    // The 'legend' contains all keys to show the legend. The real values are evaluated with the 'geLabel(key)' function above
    var data = {data:[], labels:[], legend: []};
    for (x in json2[0].cols) {
        data.data.push([]);
        data.legend.push(json2[0].cols[x].metric);
    }
    for (x in json2[0].cells) {
        var time = json2[0].cells[x].d;
        var values = json2[0].cells[x].v;
        if (x%10 == 0) data.labels.push(time);
        for (y in values) {
            data.data[y].push(values[y]);
        }
    }
    return data;
}
Here for example a JSON-Request Settings-Page:
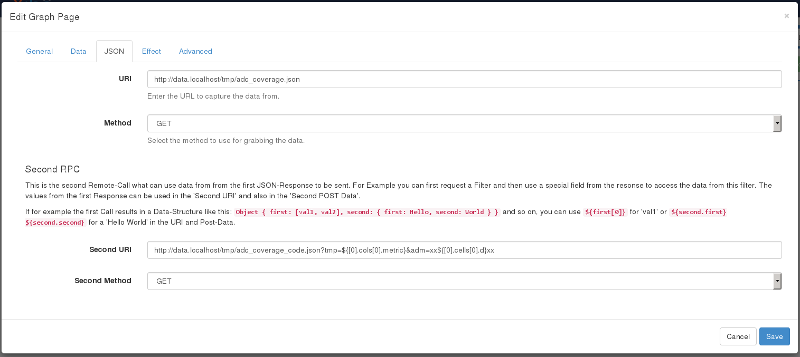
On the second JSON-RPC Uri (and also post-data area) you can use all values from the first JSON-Response.
If for example the first Call results in a Data-Structure like this: Object { first: [val1, val2], second: { first: Hello, second: World } } and so on, you can use ${first[0]} for val1 or ${second.first} ${second.second} for a Hello World in the URI and Post-Data.
On the last page, the Advaced panel, you can define to show a legend and position it. Depending on what you select the field disapear magically :)
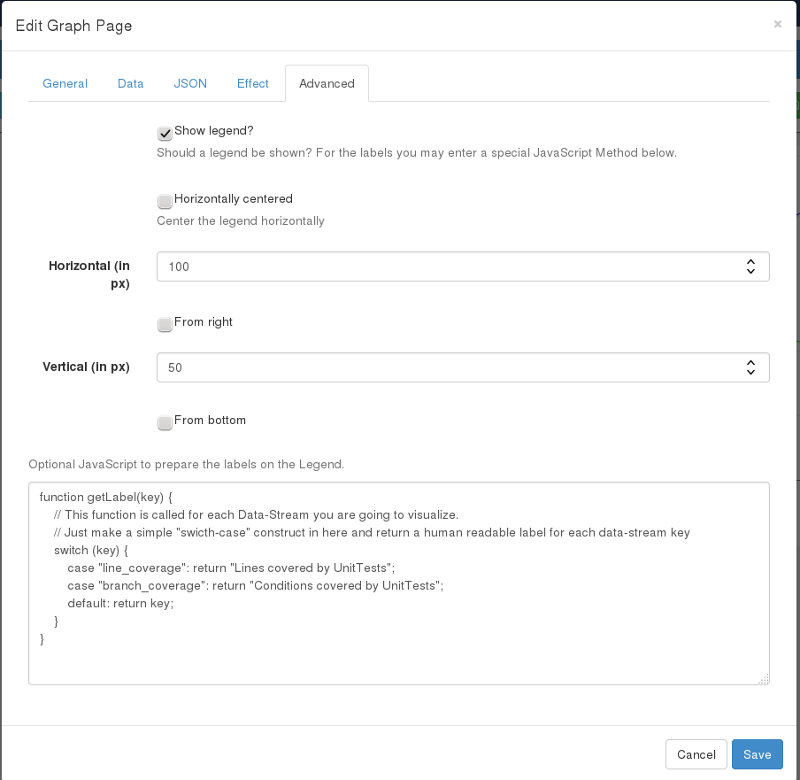
The optional Javascript is for a mapping from Label-Keys to a human readable String. For Example there could be something like this when you request Data from SonarCube:
function getLabel(key) {
    // This function is called for each Data-Stream you are going to visualize.
    // Just make a simple "swicth-case" construct in here and return a human readable label for each data-stream key
    switch (key) {
        case "line_coverage": return "Lines covered by UnitTests";
        case "branch_coverage": return "Conditions covered by UnitTests";
        default: return key;
    }
}
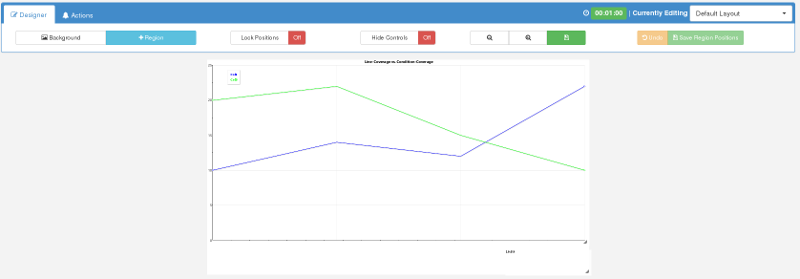
Finally you will see something like this in on the Layout-Page:
Developing
Developing a new custom module for Xibo id quite easy. There is a good documentation but more helpful for me where the eisting modules.
All in All this are the main steps:
- Create a folder named like your module in the
customFolder - Create a File in the
customFolder named likeMODULE.jsonwith Content like this:
{
  "title": "RGraph Data-Visualization",
  "author": "Lukas Zurschmiede",
  "description": "A module to visualize data from JSON or a local Datastore with a Graph.",
  "name": "rgraph",
  "class": "Xibo\\Custom\\MODULE\\MODULE"
}
- If you need 3rd-Party Libraries, create a Folder
web/vendor/MODULEand place all Files in there. - If you need images or other resources, place them in
web/modules/MODULE. - In your
custom/MODULEFolder create the Class-File and the Template-Files: ** Case sensitive: MODULE.php ** Lower-Case: MODULE-form-add.twig ** Lower-Case: MODULE-form-edit.twig ** Optionally I think, Lower-Case: MODULE-form-settings.twig
Files
For example twig files check out the existing templates in the modules Folder.
The built-in modules you find in the `` Folder. Basically a module has the following structure:
namespace Xibo\Custom\MODULE;

use InvalidArgumentException;
use Respect\Validation\Validator as v;

class MODULE extends \Xibo\Widget\ModuleWidget {
	public $codeSchemaVersion = 1;
	private $resourceFolder;

	/**
	 * MODULE constructor.
	 * @Override
	 */
	public function init() {
		$this->resourceFolder = PROJECT_ROOT . '/web/modules/MODULE';
		v::with('Xibo\\Validation\\Rules\\');
	}

	/**
	 * Install or Update this module
	 * @param ModuleFactory $moduleFactory
	 * @Override
	 */
	public function installOrUpdate($moduleFactory) {
		// Install
		if ($this->module == null) {
			$module = $moduleFactory->createEmpty();
			$module->name = 'MODULE';
			$module->type = 'MODULE'; // lower-case
			$module->viewPath = '../custom/MODULE';
			$module->class = 'Xibo\Custom\MODULE\MODULE';
			$module->description = 'Graphical data visualization';
			$module->imageUri = 'forms/library.gif';
			$module->enabled = 1;
			$module->previewEnabled = 1;
			$module->assignable = 1;
			$module->regionSpecific = 1;
			$module->renderAs = 'html';
			$module->schemaVersion = $this->codeSchemaVersion;
			$module->defaultDuration = 240;
			$module->settings = [];
			$this->setModule($module);
			$this->installModule();
		}
		// Check we are all installed
		$this->installFiles();
	}

	/**
	 * Install all 3rd-Party Files
	 */
	public function installFiles() {
		$this->mediaFactory->createModuleSystemFile(PROJECT_ROOT . '/web/modules/vendor/MODULE/....js')->save();
		$this->mediaFactory->createModuleSystemFile(PROJECT_ROOT . '/web/modules/vendor/MODULE/....js')->save();
	}

	/**
	 * Optional: Remove this method if there is no special settings form
	 *
	 * Form for updating the module settings
	 * @return Name of the Settings-Form
	 * @Override
	 */
	public function settingsForm() {
		return 'module-form-settings';
	}

	/**
	 * Process any module settings
	 * @return An array of the processed settings.
	 * @Override
	 */
	public function settings() {
		$this->module->settings['SETTING_NAME'] = $this->getSanitizer()->getString('SETTING_NAME', ...);
		$this->module->settings['SETTING_NAME'] = $this->getSanitizer()->getString('SETTING_NAME', ...);
		return $this->module->settings;
	}

	/**
	 * Validates the settings when saving a layout
	 * @Override
	 */
	public function validate() {
		if ($this->getUseDuration() == 1 && $this->getDuration() == 0)
			throw new InvalidArgumentException(__('You must enter a duration.'));
	}
	/**
	 * Adds a Widget
	 * @Override
	 */
	public function add() {
		$this->setOption('name', $this->getSanitizer()->getString('name'));
		$this->setUseDuration($this->getSanitizer()->getCheckbox('useDuration'));
		$this->setDuration($this->getSanitizer()->getInt('duration', $this->getDuration()));

		$this->setOption('SETTING_NAME', $this->getSanitizer()->getString('SETTING_NAME'));
		$this->setOption('SETTING_NAME', $this->getSanitizer()->getString('SETTING_NAME'));

		$this->validate();
		$this->saveWidget();
	}
	/**
	 * Edit the Widget
	 * @Override
	 */
	public function edit() {
		$this->setOption('name', $this->getSanitizer()->getString('name'));
		$this->setUseDuration($this->getSanitizer()->getCheckbox('useDuration'));
		$this->setDuration($this->getSanitizer()->getInt('duration', $this->getDuration()));

		$this->setOption('SETTING_NAME', $this->getSanitizer()->getString('SETTING_NAME'));
		$this->setOption('SETTING_NAME', $this->getSanitizer()->getString('SETTING_NAME'));

		$this->validate();
		$this->saveWidget();
	}

	/**
	 * Preview code for a module
	 *
	 * @param int $width
	 * @param int $height
	 * @param int $scaleOverride The Scale Override
	 * @return string The Rendered Content
	 * @Override
	 */
	public function preview($width, $height, $scaleOverride = 0) {
		return $this->previewAsClient($width, $height, $scaleOverride);
	}

	/**
	 * GetResource for the Graph page
	 *
	 * @param int $displayId
	 * @return mixed|string
	 * @Override
	 */
	public function getResource($displayId = 0) {
		// Load in the template
		$data = [];

		// Replace the View Port Width?
		$isPreview = ($this->getSanitizer()->getCheckbox('preview') == 1);

		// Replace the View Port Width?
		$data['viewPortWidth'] = ($isPreview) ? $this->region->width : '[[ViewPortWidth]]';

		// Head Content contains all needed scrips from XY
		$headContent  = '<script type="text/javascript" src="' . $this->getResourceUrl('vendor/MODULE/....js') . '"></script>'."\n";
		$data['head'] = $headContent;

		// Body content
		$data['body'] = '<div id="MODULE_Content_Whatever_' . $displayId . '">
			Put and create here your HTML
		</div>';

		// After body content - mostly XIBO-Stuff for scaling and so on
		$javaScriptContent  = '<script type="text/javascript" src="' . $this->getResourceUrl('vendor/jquery-1.11.1.min.js') . '"></script>';
		$javaScriptContent .= '<script type="text/javascript" src="' . $this->getResourceUrl('xibo-layout-scaler.js') . '"></script>';
		$javaScriptContent .= '<script>
			$(document).ready(function() {
				var options = ' . json_encode($options) . '
				$("#' . $containerId . '").xiboLayoutScaler(options);
		});

		// Replace the After body Content
		$data['javaScript'] = $javaScriptContent;
		return $this->renderTemplate($data);
	}

	/**
	 * Returns if this module is valid or not.
	 *   0 => Invalid
	 *   1 => Valid
	 *   2 => Unknown
	 * @return Validation-Level
	 * @Override
	 */
	public function IsValid() {
		// Can't be sure because the client does the rendering
		return 2;
	}
}